

Most e-commerce founders I’ve spoken with are looking at the wrong problem. Their store is getting traffic. Real traffic. People landing on product pages, spending time on the site, adding items to carts. And yet revenue stays stubbornly flat month after month.
The instinct is to run more ads. To post more content. To chase more reach. That logic is understandable but it’s also expensive. Pouring more visitors into a funnel that isn’t converting efficiently means you’re paying more to get the same output. The leak is still there. You’ve just turned up the tap.
Conversion in digital marketing is the system that fixes the leak first. It’s the discipline of understanding why visitors don’t buy, and changing the conditions that make buying harder than it needs to be. For e-commerce specifically, it’s one of the highest-leverage activities a founder can invest in because the upside compounds. Improve your conversion rate from 1.4% to 2.8% and you’ve doubled your revenue from the same traffic. No extra ad spend required.
This isn’t abstract. The average Shopify store converts at around 1.4%. The top 20% of stores convert at 3.2% or above. That gap between a typical store and a well-optimized one isn’t explained by better products or better ad targeting. It’s explained by better systems.
Only 39.6% of companies have a documented CRO strategy. That number is worth sitting with for a moment. More than half of e-commerce businesses are making optimization decisions without a repeatable framework to guide them. This article is the framework.
We’ll cover what conversion actually means, how to measure it correctly, and where the highest-value optimization work happens across your funnel. Each section connects to a deeper resource if you want to go further on any topic.
Key takeaways
- Conversion is any action that moves a visitor toward your business goal. Most stores track too many and prioritize too few.
- Your overall conversion rate is a headline number. Step-level rates tell you where the funnel is actually breaking.
- Most e-commerce conversion gains come from fixing product pages, checkout flows, and trust signals, not from increasing traffic.
- Reliable tracking in GA4 is a prerequisite for any CRO work. Without it, you’re optimizing against data you can’t trust.
- A conversion rate optimization system compounds over time. Each fix raises the floor for every visitor who comes after.
What “conversion” actually means in e-commerce
A conversion is any action a visitor takes that moves them closer to your business objective. In its simplest form for e-commerce, a completed purchase is the conversion. But that definition, while correct, leaves out most of what makes CRO work as a system.
Not all conversions are equal. An email signup is a conversion. Adding a product to cart is a conversion. Watching a product video is a conversion. The problem is that treating all of these the same way in your reporting creates noise that obscures what’s actually driving revenue.
The distinction that cleans this up is macro vs micro conversions. Your macro conversion is the action directly tied to revenue, typically a completed purchase. Every action that precedes it is a micro conversion: a funnel milestone or an engagement signal that helps you understand where buyers are in their decision process.
This separation matters operationally. If you’re celebrating a spike in newsletter signups while your purchase completion rate drops, you’re reading the wrong signal. Micro conversions are diagnostic tools. They tell you where people are dropping off and why. They’re not success metrics on their own.
For a full operational breakdown of how to define conversion goals that reflect revenue rather than activity, [Macro vs Micro Conversions: How to Define the Right Goals for E-commerce Growth] covers the hierarchy in detail.
The metrics that actually tell you where to optimize
Here’s a situation I run into often. A store owner pulls up their analytics, sees a 1.8% conversion rate, compares it to a competitor benchmark, and decides their site needs a redesign. But the overall conversion rate tells you nothing about where the problem lives. It’s a summary number. You can’t operate on a summary.
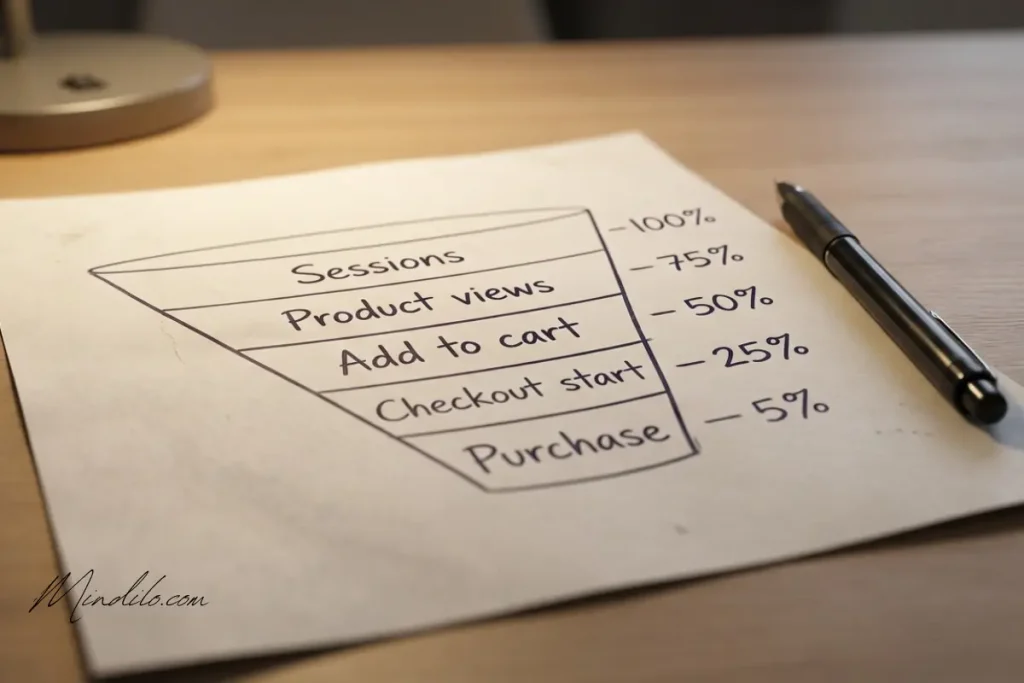
The version of conversion measurement that’s actually useful to CRO work is step-level. You break your funnel into individual transitions: session to product page, product page to add to cart, add to cart to checkout initiation, checkout start to purchase. Each transition has its own rate and each rate points to a different problem if it’s low.
A store with a 7% add-to-cart rate but a 20% checkout completion rate has a checkout problem. A store with a 2% add-to-cart rate and a 65% checkout completion rate has a product page problem. Those are two completely different optimization priorities. The overall conversion rate of 1.4% looks identical on the surface.
There’s also the question of which formula you’re using. A session-based conversion rate and a user-based conversion rate produce different numbers from the same dataset because they measure different things. And if your team is pulling numbers from three different tools, you’ll likely see three different figures even for the same metric in the same period.
Getting your measurement methodology agreed upon before you start optimizing is a prerequisite, not a preliminary step. [Conversion Rate Explained: How to Calculate It (and Which Version to Use for E-commerce)] covers the formulas, the platform discrepancies, and how to build a shared measurement protocol your whole team can work from.
Clean tracking as the foundation of everything
I’ve watched CRO projects waste months of work because the data they were optimizing against was wrong. A purchase event firing twice on the order confirmation page. Revenue figures in GA4 that didn’t match Shopify by several thousand dollars a month. Checkout step events that stopped firing after a theme update nobody logged.
When your tracking is broken, your data still produces reports. That’s what makes it dangerous. The numbers look real. Teams make decisions based on them. Tests get called as wins or losses based on conversion counts that don’t reflect what actually happened.
Reliable GA4 conversion tracking is the infrastructure your entire CRO operation runs on. It’s not exciting to set up. It won’t make your landing page prettier or your copy sharper. But it’s the difference between running a coherent optimization program and running expensive guesswork dressed up as analysis.
In GA4, the events you need for e-commerce are well-defined: view_item, add_to_cart, begin_checkout, and purchase. The purchase event needs to pass a unique transaction ID to prevent duplicate counting. Event names need to be consistent across your implementation or GA4 will treat variations as separate events. The whole setup should be tested with DebugView before you rely on it for any decision-making.
[GA4 Conversion Tracking for E-commerce: Events, Key Events, and Clean Measurement Setup] covers the full implementation including how to spot duplicate events, what parameters each event needs to pass, and how to verify your setup is working correctly before launching a test.
The product page is where most conversion work lives
Think about the sequence of events that leads to a purchase. A visitor arrives, usually on a product page. They form a first impression in about three seconds. They scan, they read, they look for a reason to feel confident. If the page gives them clarity and trust, they add to cart. If it leaves them with unanswered questions, they leave.
For most e-commerce stores, the product page is the highest-leverage point in the conversion funnel. It’s where intent meets information. And it’s where most stores quietly underperform without realizing it because the traffic is arriving but the page isn’t doing the job.
The average add-to-cart rate for Shopify stores sits around 4.4%. The top 20% achieve 7.6% or above. That gap is rarely about traffic quality. It’s about whether the product page helps a visitor make a decision or creates just enough friction to delay it indefinitely.
What moves a product page from passive to persuasive is a specific set of structural elements: a title that removes ambiguity, a primary image that shows the product in use, a dominant add-to-cart button that doesn’t compete with the surrounding layout, benefit-led copy that addresses objections before they’re formed, and trust signals positioned where hesitation peaks rather than buried in a footer.
None of those elements require a rebuild. Most can be addressed individually, measured after each change, and compounded over time. [E-commerce Product Page Optimization: A Practical Checklist to Increase Add-to-Cart Rate] walks through a complete audit checklist covering above-the-fold structure, copy, gallery, and trust placement in the sequence that produces the fastest gains.
Checkout is where intent becomes revenue or disappears
A visitor who adds a product to cart has already made the psychological decision to buy. The checkout is where that decision either completes or collapses. And it collapses far more often than most store operators account for.
The average cart abandonment rate globally is 70.2%. That means roughly seven out of every ten people who commit to the cart never complete the purchase. On mobile, that number rises to 85.2%. These aren’t passive browsing sessions. These are buyers who had purchase intent and were stopped by something in the checkout itself.
The causes are well-documented and surprisingly consistent. 48% of checkout abandonment is caused by unexpected costs, typically shipping fees that appear for the first time at the payment step. 24% of buyers abandon when forced to create an account before purchasing. 25% cite security concerns at the payment step. 13% leave when their preferred payment method isn’t available.
Every one of those causes has a direct operational fix. Show shipping costs before checkout begins. Enable guest checkout and make it the default path. Place trust signals adjacent to the payment form. Expand your payment options to include the methods your specific market relies on. These aren’t conversion experiments requiring A/B testing infrastructure. They’re known friction points with known solutions.
The checkout is also where step-level tracking provides its clearest diagnostic value. When you can see the drop-off rate between each specific step, you stop guessing which friction is doing the most damage and start fixing the one causing the most abandonment. [Checkout Optimization for E-commerce: Reduce Friction and Improve Completion Rate] covers the full friction audit in the sequence that produces the fastest improvement to completion rate.
Social proof: the trust layer that reduces hesitation at scale
There’s a specific type of visitor behavior that I find both predictable and fixable. Someone arrives on a product page, scrolls through all the content, spends 90 seconds reading everything, and then leaves without adding to cart. They weren’t confused. They weren’t put off by the price. They just didn’t feel confident enough to commit.
That behavior is purchase anxiety. And it appears most often on pages where social proof is either absent or poorly positioned. The visitor is looking for evidence that other real people bought this product and it was worth it. If the page doesn’t provide that evidence prominently, they default to caution.
93% of consumers read reviews before making a purchase decision. Products with more than 11 reviews convert approximately 68% higher than those with none. Visitors who interact with user-generated content on a product page convert at more than double the rate of those who don’t engage with it. These are not marginal effects. They’re the difference between a product page that closes buyers and one that loses them at the last step.
Social proof works because it transfers risk from the buyer to the collective. When a hesitant first-time buyer sees 247 reviews, a 4.3-star rating, and three customer photos of the product in real use, they’re no longer making a solo judgment. They’re joining a decision that hundreds of others already made. That shift in perception is more powerful than most product copy changes.
The placement of social proof matters as much as its presence. Star ratings and review counts belong near the product title, not at the bottom of the page. A short testimonial between the product description and the add-to-cart button is more effective than a full review section three screens below. Trust badges have their highest impact directly adjacent to the payment form where security anxiety peaks.
[Social Proof That Converts: Reviews, UGC, and Trust Signals for E-commerce Product Pages] covers the full placement strategy, how to generate a steady flow of reviews post-purchase, and how to integrate customer photos into the product page in a way that adds credibility without cluttering the layout.
FAQ
What does conversion mean in digital marketing for e-commerce?
A conversion is any action a visitor takes that moves them toward your business goal. For e-commerce, the primary conversion is a completed purchase. Secondary conversions (micro conversions) include add to cart, checkout initiation, and email signup. The key distinction is that micro conversions are diagnostic signals, not success metrics. Your primary conversion rate should always be tied directly to revenue-generating action.
What’s a good conversion rate for an e-commerce store?
The average Shopify store converts at around 1.4%. The top 20% achieve 3.2% or above. Rather than benchmarking against a generic industry number, the more useful practice is tracking your own step-level rates over time and comparing them against your previous performance after each optimization. A store improving from 1.4% to 2.1% has made a 50% revenue gain from existing traffic. That internal benchmark is more actionable than a sector average.
Why should I focus on conversion optimization instead of just getting more traffic?
Because conversion optimization is a fixed-cost improvement with compounding returns. When you improve your checkout completion rate by 15%, every visitor who enters checkout from that point forward benefits from it, including every visitor your future ad spend brings in. More traffic through an unoptimized funnel means spending more to get the same output. CRO improves the efficiency of every marketing activity you run alongside it.
Where does most e-commerce conversion loss actually happen?
The two highest-loss points for most stores are the product page and the checkout. Low add-to-cart rates (below 4%) usually indicate a product page problem: unclear value proposition, weak copy, poor image quality, or missing trust signals. High checkout abandonment (above 70%) usually points to cost surprises, form friction, or missing payment options. Step-level tracking in GA4 tells you exactly which transition is losing the most visitors in your specific funnel.
How do I start a CRO program without a big team or budget?
Start with measurement. Set up your GA4 funnel tracking correctly, agree on a shared formula for conversion rate, and identify your biggest drop-off step. Then fix the single highest-impact issue at that step before moving on. Most meaningful CRO gains come from removing obvious friction rather than sophisticated experimentation. You don’t need a testing platform to show shipping costs earlier, enable guest checkout, or move trust badges next to your add-to-cart button.
Build the system before you scale the spend
Conversion in digital marketing is ultimately a systems discipline. The brands that grow efficiently aren’t necessarily the ones with the biggest ad budgets or the most recognized names. They’re the ones that understand what happens between a visitor arriving and a purchase completing, and they work methodically on each step.
The framework this article lays out doesn’t require you to do everything at once. Fix your measurement first. Then identify your biggest funnel bottleneck. Then work through product page, checkout, and trust layer improvements in the sequence that your data supports. Each improvement raises the floor for every visitor who follows.


Pingback: Macro vs micro conversions: how to define the right goals for E-commerce growth